Working closely with doctors that specialize in swallowing disorders, we built a simple application that can be used to assist in complicated diagnosis. This post explains how.
Collecting Data
To do this, we built and deployed a mobile friendly application that allowed a number of physicians to go step by step through patient history, test results and previous surgery, treatment, etc. and input the data necessary to make a diagnosis.
Essentially the physicians input specific history and test results to see the likely diagnosis right in the application.
We also built a file import function to allow the users to upload a file containing the values for a large number of results together. This was particularly useful for testing different classes of outcomes from input data.
Scoring
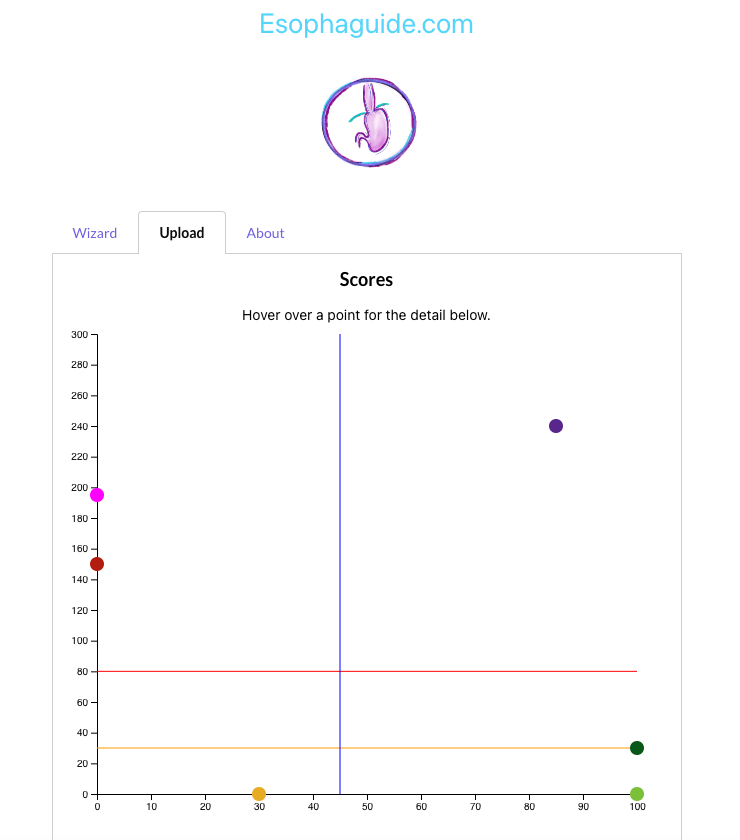
The scoring itself was largely the doctors’ specialty. We assigned points to different associated conditions or test results and coded the algorithm to assign the points based on the history and test results that were supplied. The points could be applied to different axes and mapped to an x,y,z value on a graph. Different regions of the graph mapped to different likely diagnoses.
To develop effective scoring, we need to analyze how each test effects the outcome, to what degree and why. The partnership with the physicians was vital for this to be effective. While we understand the diagnosis and scoring, we are not medical experts and could not have developed it from scratch.
Thus, based on the score, we recommend a likely diagnosis or a set of likely diagnosis. We use plotting and color coding to make the picture clearer. See below.

Testing
One of the neat things about capturing algorithms with code is that we can automate tests that show that inputs produce expected results. We did this. We also used sample data from hundreds of patients to validate that the results we obtained matched expert clinical assessment.